
[Disclaimer: I am not an EEG expert. I probably got some things wrong. Please let me know about them.]
TL;DR: I reviewed four infant ERP studies on the same topic and found that their results are maximally incongruent with each other. Yet the analytical choices made in the papers differ too much to even allow the conclusion that there probably is no underlying effect.
If you just want to skim this post, you can skip to the short summaries at the end of each section, which I highlighted so they’re easy to find.
Estimated reading time (excl. tables): 17 minutes

Some weeks ago, I reviewed an EEG paper on infants’ perception of biological motion. The authors cited four older studies that report ERP correlates of 5- and 8-month-old children’s ability to discriminate normal human motion, such as walking, from different forms of unnatural or non-biological motion.
Because I wasn’t familiar with this literature and wanted to be a good reviewer, I went and had a look at these fab four. What I found was a combined sample size of 51, four different analysed time windows and region-of-interest combinations, a left-skewed p-curve, and a lot of question marks on my forehead. This blog post is a story of my journey digging through these papers to see what they can tell us about infants’ perception of biological motion.
The four studies in question:
| HH05 | Hirai, M., & Hiraki, K. (2005). An event-related potentials study of biological motion perception in human infants. Brain Research: Cognitive Brain Research, 22, 301–304. |
| RHS06 | Reid, V. M., Hoehl, S., & Striano, T. (2006). The perception of biological motion by infants: An event-related potential study. Neuroscience Letters, 395, 211–214. |
| RHLS08 | Reid,V. M., Hoehl, S., Landt, J.,& Striano, T. (2008). Human infants dissociate structural and dynamic information in biological motion: Evidence from neural systems. Social Cognitive and Affective Neuroscience, 3, 161–167. |
| MS09 | Marshall, P. J. & Shipley, T. F. (2009). Event-related potentials to point-light displays of human action in five-month-olds infants. Developmental Neuropsychology, 34(3), 368-377. doi: 10.1080/87565640902801866 |
Background
You have probably seen videos of point-light displays (PLDs) of human motion before: Single dots represent the joints of a person and despite this seemingly impoverished setup (compared to a normal video recording), it is surprisingly easy to recognise the displayed action, e.g., a walking person. I didn’t embed an example video because I don’t want to scare away my new pals with an Elsevier lawsuit this early, but the Biomotion Lab at Queen’s University has put some of their cool stimuli online.
Whenever you find that you can perform some cognitive task with apparent ease (like recognising a bunch of moving dots as a walking person), a developmental psychologist somewhere gets very itchy and really, really wants to know at what exact point between its nonexistence and current giant-walnut-like state your brain acquired this intriguing skill.
Several studies have reported that 3- to 9-month-olds and apparently even newborns can tell PLDs with upright human motion from scrambled or inverted displays (e.g. Fox & McDaniel, 1982; Berthenthal, Proffitt, & Cutting, 1984; Berthenthal, Proffitt, Kramer, & Spetner, 1987; Méary, Kitromilides, Mazens, Graff, & Gentaz, 2007; Simion, Regolin, & Bulf, 2008).
The four papers I’m reviewing here look for EEG correlates of this previously found behavioural effect via event-related potentials (ERPs). My aim is to find out if they can tell us something about what happens on an infant’s scalp when they watch PLDs of upright human motion. I will first give a very brief summary of each study and then compare their analytical choices and results with a focus on the contrast between upright biological motion (BM) and “non-biological motion” (nBM).
You will notice that in almost all cases, the nBM PLDs consist of points whose motion paths and velocity are identical to the points in the BM PLDs. “Non-biological” thus refers to the relation of the individual points to each other (in scrambled PLDs, where the points’ starting positions have been randomised) or to the orientation of the displayed figure (in inverted PLDs that have been turned upside down).
Because EEG results depend heavily on many boring but important technical details about recording and analysis, this post contains a bunch of big, cluttered tables with a tiny font size which I feel terrible about yet not terrible enough to spare you them. I simply didn’t find a more elegant way to include all this information. Feel free to ignore most of it[1]For a good laugh I recommend having a look at Table 1 for sample sizes and exclusion rates though. if you’re only here for the stats rage.[2]It’s totally a thing.
Alright! Fasten your seatbelts, here we go:
Overview
HH05 (Hirai & Hiraki, 2005)
The rationale is simple: We know infants are sensitive to biological motion, but nobody has looked at neural correlates of this before, so let’s check it out. HH05 investigate 8-month-olds’ ERPs in reaction to PLDs of upright walking compared to scrambled motion (the points’ paths and velocity are identical to the upright condition, but their starting points are randomised – check “scrambled” in the Biomotion Lab animation to get an idea). Each trial lasts 510 ms.
RHS06 (Reid et al., 2006)
RHS06 look at the same age group (8-month-olds). But in contrast to HH05, they compare upright motion to inverted motion (turning the animation upside down). With 1000 ms, their trials are twice as long as HH05’s. Another difference is that they use two different kinds of movement: walking and kicking, thus creating a 2×2 condition design (action type: walking vs kicking x orientation: upright vs inverted). What’s funny about this is that they do not once mention why they added the kicking motion, and in the remainder of the paper collapse walking and kicking into a simple contrast between upright and inverted.
My p-hacking alarm bells started to make some clunking noises when I first read this. You just don’t add stuff to an experiment and then never mention it again, especially when it sets your study apart from previous ones. You only do that when you tried something and it didn’t work. Please tell me if this is an unfair assumption.
| age | N | exclu- sions | conditions | trials/ cond. | total trials | trial length (ms) | inclusion criterion: watched trials/cond. | mean watched trials/ condition | pictures of stimuli provided? |
|
| HH05 | 8 m | 7 | 16 | 2: upright walking vs scrambled | 200 | 400 | 510 | 10 | upright: 26.1 scrambled: 23.1 | yes |
| RHS06 | 8 m | 12 | 10 | 2 (4): upright walking & kicking vs inverted walking & kicking | 50 | 200 | 1000 | 10* | 31.4** | no*** |
| RHLS08 | 8 m | 15 | 40 | 3: upright (walking & kicking) corrupted (walking with backward-flexing knees) impossible (kicking with spinning leg) | 66 | 198 | 1000 | 10 | 13.6 | yes |
| MS09 | 5 m | 17 | 25**** | 2: upright (walking, running, throwing a ball, kicking a ball) vs scrambled | 16 | 32 | 2000- 2300 | 5 | upright: 8.4 scrambled: 8.7 | no*** |
| * Refers to each cell of the original 2x2 (action x orientation) design if I understand correctly. ** Refers to the two main conditions (upright vs inverted). *** Whyyyyyyyyy? **** Plus 12 kids who wouldn’t even wear the EEG cap. I suspect similar rates in the other papers that are not reported. |
||||||||||
RHLS08 (Reid et al., 2008)
RHLS08 again investigate 8-month-olds, but throw another set of considerations into the mix: They compare upright motion (again walking and kicking) to a) a “corrupted body schema” condition where the walking PLDs were edited such that the knees bent backwards, and b) a “biomechanically impossible” condition where the kicking PLDs were edited such that the kicking leg seemed to come off and spin in a circle. Trial length is again 1000 ms.
The dropout rate in this study struck me as odd: with a final sample of N=15 and 40 exclusions, it is 3.2x as high as in RHS06 (N=12, 10 exclusions). What happened there?
This relatively high attrition rate was due to three experimental conditions in the present study when compared to the standard two conditions in most infant ERP studies. (p. 162)
Ok, but wait a second… Didn’t RHS06 start out with even more conditions (four)? Is that why they forgot about one of their factors halfway through their paper and changed it to a simple contrast between upright and inverted PLDs?
I’m not liking this.
MS09 (Marshall & Shipley, 2009)
MS09 go back to the basics – upright versus scrambled motion, but this time with 5-month-olds. Their trials are twice as long as RHS06’s and RHLS08’s (2000-2300 ms). For unnamed reasons they use four different types of action: walking, running, throwing a ball, and kicking a ball. Each condition consists of only four trials of each of these actions (16 upright, 16 scrambled). Here’s their justification for the low trial number:
ERP averages composed of less than 20 trials are not unusual in the infant visual ERP literature (e.g., de Haan & Nelson, 1997; Snyder, Webb, & Nelson, 2002), especially in studies involving dynamic social stimuli (Reid et al., 2008; Striano, Reid, & Hoehl, 2006). (p. 370)
Ah, the classic “we used a shitty design because others do it too” argument. What I find more worrying than the low total number of trials are the fairly heterogeneous stimuli: I would not expect the brain to react identically when viewing displays of continuous walking versus distinct goal-directed actions involving an inanimate object (throwing/kicking a ball). What can we expect from an average of only eight instances of each of these? I’m not an EEG expert but this simply isn’t going to work.
Summary: overview
We have two studies comparing upright and scrambled motion (HH05 and MS09), one comparing upright and inverted motion (RHS06), and one comparing upright motion with a “corrupted body schema” condition and a “biomechanically impossible” condition (RHLS08). Three studies look at 8-month-olds and one looks at 5-month-olds.
| electrodes | online filter | offline filter | sampling rate | online ref | offline ref | baseline correction | |
| HH05 | 62, Geodesic Sensor Net | 0.1 - 100 Hz bandpass | 30 Hz low-pass | 250 Hz | vertex | scalp avg. | 100 ms pre trial |
| RHS06 | 19 (10-20 system) | ? | ? | 250 Hz | vertex | linked mastoids | 100 ms pre trial |
| RHLS08 | 23 (10-20 system) | ? | 0.1 Hz high-pass 35 Hz low-pass | 250 Hz | vertex | linked mastoids | 100 ms pre trial + first 100 ms of trial |
| MS09 | 20 (10-20 system), Electro-Cap | 0.1 Hz high-pass 100 Hz low-pass | ? | 512 Hz | vertex | linked mastoids | 100 ms pre trial |
Design & analysis
Which dependent variables did the studies look at? In other words: Which time windows at which electrode sites were analysed? (See Table 2 for boring EEG recording details.)
HH05 define a target time window at 200-300 ms after trial onset based on adult ERP data. To me this sounds surprising because as a rule of thumb I would expect infant ERPs to show up later[3]Because let’s face it, babies are a bit dim. than corresponding adult ERPs. But anyway, at least they do give a justification. They pick 26 electrodes in the occipitotemporal region as their target area (see Figure 1) and compare right and left hemisphere (13 electrodes on each side). They do not provide any justification for either the chosen area or the fact that they compare left and right hemisphere (now their design turned into a 2×2 interaction: stimulus type x lateralisation).
RHS06 stick with the time window of 200-300 ms, with the analysis of lateralisation effects, and, broadly speaking, with the target area (“posterior”): They compare P3 and CP5 on the left with P4 and CP6 on the right. Interestingly, they do not cite HH05, even though they submitted their paper almost a year after HH05 had been published online. Instead, RHS06 justify the time window (and the search for lateralisation effects) by pointing to studies reporting an N170 in adults in response to BM and the claim that “in infant research, the P220–P290 waveform has been named the ‘infant N170’” (p. 212). Alright, sounds legit. Their justification for the target area is less consistent: Again, they cite the adult-N170 literature, which reported this effect “at a variety of posterior locations, including occipital (O1, O2), temporal (T7, T8) and parietal cortex (P7, P3, P4, P8)” (p. 212). Sadly, the reason why they then confined their analyses to P3, P4, CP5, and CP6 remains a mystery for the reader.
Somewhat unexpectedly, RHLS08 cite both themselves (RHS06) and HH05 as a reference for looking at parietal regions, but quietly drop CP5/CP6 and the lateralisation effect (P3 and P4 are now being analysed jointly and not compared with each other). What really stunned me is that they changed the analysed time window to 300-700 ms without any justification. This means their analysis window at the parietal region does not even overlap with HH05 and RHS06.
A variation of the old time window comes into play again for the newly-added frontal target area: They include a region composed of F7, F8, F3, F4, Fz, FC3, FC4, C3, C4, and Cz at 200-350 ms (again without justification), because they hypothesise “differential processing in parietal and frontal regions” (p. 162) for the contrast between corrupted and impossible PLDs.
There’s one more thing. All other papers use 100 ms directly preceding the trial for baseline correction, only RHLS use 100 ms pre trial and the first 100 ms of the trial. Their justification for this makes no sense in light of the other studies:
This ensured that differences in the ERP were due to factors associated with motion rather than a reaction to observed differences between the conditions in the initial configuration of the point lights. (p. 164)
MS09 go on a big fishing expedition and test the full trial length from 0-2000 ms in 100-ms bins separately for P3, P4, P7, P8, T7, T8, O1, and O2 (citing Jokisch et al., 2005; HH05; and RHS06). They also hypothesise a lateralisation effect, citing RHS06, but never directly compare any electrodes from the right and left hemisphere. MS09 thus run 20 separate tests for each of 8 electrodes (160 tests in total) and – spoiler alert – do not correct for multiple comparisons.
Summary: design & analyses
We have three different time windows for the BM versus nBM contrast (HH05 and RHS06: 200-300 ms, RHLS08: 300-700 ms, MS09: 0-2000 ms), and a fourth one if we include RHLS08’s search for a frontal difference between corrupted and impossible motion (200-350 ms). All studies look at “somewhat” posterior/parietal electrode sites, but in many creative combinations: a large ill-defined area on the left vs on the right (HH05), P3 and CP5 on the left vs P4 and CP6 on the right (RHS06), P3 and P4 combined (RHLS08), and an 8-electrode carnage involving P3, P4, P7, P8, T7, T8, O1, and O2 (MS09).
| conditions | target areas | target time window | analysis | results | p | |
| HH05 | upright vs scrambled | occipitotemporal: 26 electrodes collapsed into 2 sites (left vs right) | 200-300 ms | 2x2 ANOVA: laterality vs stimulus type - interaction - main effects - upright vs scrambled in RH* | . F(1,6)=7.1 reported as ns F(1,12)=7.1 | . .037 .021 |
| RHS06 | upright vs inverted | left posterior: P3, CP5 right posterior: P4, CP6 | 200-300 ms | 2x2 ANOVA: laterality vs stimulus type - interaction - main effects - simple effects | . F(1,11)=6.767 “no other effects found” not reported | . .025 |
| RHLS08 | upright vs corrupted vs impossible | parietal: P3, P4 frontal: F7, F3, Fz, F4, F8, FC3, FC4, C3, Cz, C4 | parietal: 300-700 ms frontal: 200-350 ms | parietal: 3x1 ANOVA t-test upright vs impossible t-test upright vs corrupted t-test imposs. vs corrupted frontal: 3x1 ANOVA t-test upright vs impossible t-test upright vs corrupted t-test imposs. vs corrupted | F(2,28)=3.535 t(14)=2.312 not reported t(14)=1.803 F(2,28)=5.517 not reported t(14)=2.142 t(14)=2.735 | .043 .037 .093** .0096 .0503*** .016 |
| MS09 | upright vs scrambled | mid-parietal: P3, P4 lateral parietal: P7, P8 occipital: O1, O2 temporal: T7, T8 | whole trials (0-2000 ms) | Wilcoxon signed-rank tests on mean amplitude in 100 ms bins across whole trials & each electrode | No test statistics reported. Electrodes & time frames reported as “p<.05”: P3: 800-2000 ms P4: 1300-2000 ms P7: 500-2000 ms P8: 500-2000 ms O2: 800-1300 ms T8: 600-2000 ms |
|
| * RH = right hemisphere ** Reported as “a statistical trend” (p. 164) *** Reported as “p = .05” (p. 164) |
||||||
Results
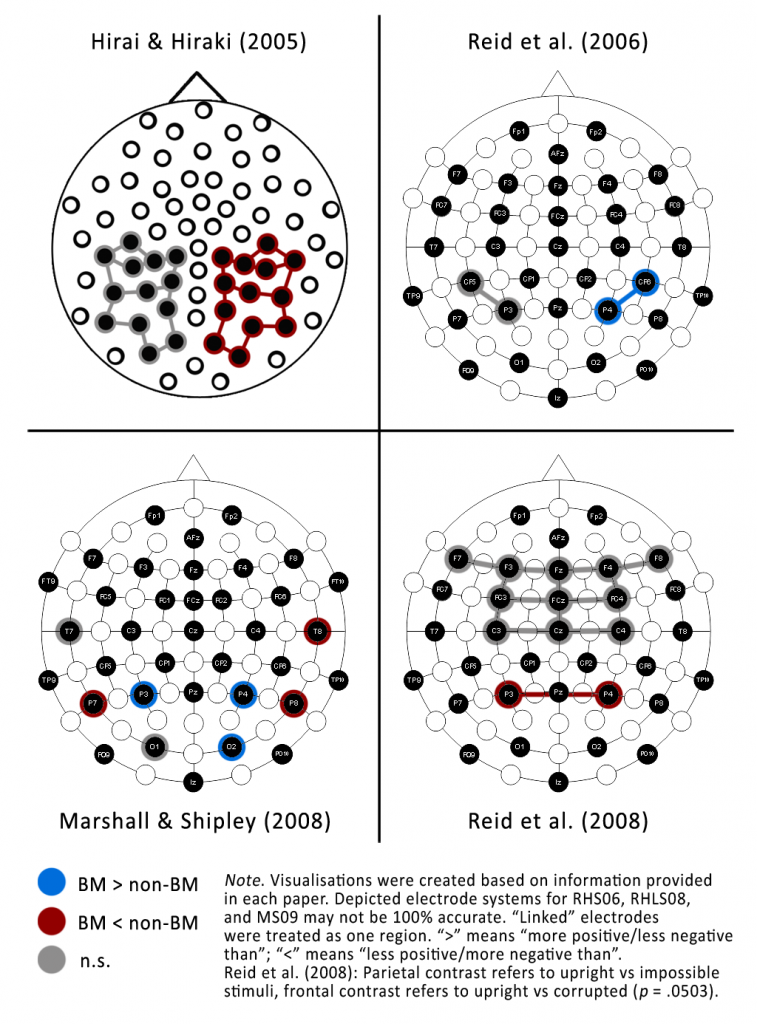
Test statistics and summary statistics are summarised in Table 3 and Table 4, respectively, and the directions of effects are shown in Figure 1. I will ignore the results for the frontal region examined by RHLS08, because they added this to investigate the perception of “corrupted body schema” motion and I decided to focus on the contrast of upright vs impossible motion.
Up until the result section, I expected HH05 to look for a main effect of stimulus type. This main effect is implied to be not significant: “only the laterality x stimulus type interaction was significant” (p. 302). Luckily they thought of lateralisation just in time![4]Phew! Taking this into account, they find a significant interaction: upright motion had a more negative amplitude than scrambled motion in the right hemisphere, but this contrast was reversed and not significant in the left hemisphere.
HH05 do not correct for multiple comparisons (despite testing one interaction effect and two main effects), which the interaction effect would not have held up to: F(1, 6) = 7.1, p = .037.
In contrast to HH05, RHS06 do predict an interaction of stimulus type and lateralisation, which is exactly what they find (F(1, 11) = 6.767, p = .025). Here, however, the amplitude for upright motion in the right hemisphere is significantly more positive than for inverted motion. One could argue that scrambled (HH05) and inverted (RHS06) PLDs may well elicit very different ERPs and that a reversed effect may thus not be surprising. But it’s important to note that the ERPs for upright motion look completely different in the two papers: Within the right hemisphere, mean amplitude in HH05 is roughly -9 μV, SE = 3 μV (taken from Figure 2B in the manuscript), whereas in RHS06 it is +1.95 μV, SE = 1.23 μV (p. 212-213). The difference between these values is d = 1.7!
RHLS08 do not mention lateralisation. They hypothesise a simple contrast between upright and impossible motion in the parietal area. What’s funny is that they cite HH05 to predict a more positive amplitude for upright stimuli even though we just saw that HH05 found a more negative amplitude:
Based on previous research (e.g. Hirai and Hiraki, 2005), we hypothesized that the perception of biological facets of the stimuli would manifest themselves in a parietal location with an increase in positivity for the biological motion compared to the biomechanically impossible motion. (p. 162)
They find a main effect of condition and a significant simple contrast between upright and impossible stimuli (t(14)=2.312, p = .037), which would not hold up to Bonferroni correction (they performed at least two post-hoc tests: corrupted vs impossible is not significant, upright vs corrupted is not reported[5]I have a quantum theory of unreported test results: They are simultaneously significant and not significant until you look at them, which immediately renders them not significant.). Interestingly, mean amplitude for upright motion is positive like in RHS06, but this time less positive than the amplitude for impossible motion despite being way larger than in RHS06: M = 6.28 μV, SE = 2.57 μV. This is noteworthy because the number represents an average across both hemispheres, not just of the right hemisphere as in RHS06. If the amplitude for upright motion had been smaller in the left hemisphere like it was in RHS06 and HH05, this should have attenuated the overall effect and an average of this magnitude would be even less likely.
It may be hard to believe that these contradictory results could become even messier, but MS09 add yet another pattern to the mix: For the mid-parietal electrodes P3 and P4, they find significantly more positive activation for upright motion from 800 ms onwards (well outside the analysis window of any of the other studies), but for lateral parietal electrodes P7 and P8, the amplitude is less positive/more negative from 500 ms onwards. I don’t quite know what to make of this due to their creative 160-uncorrected-tests approach and the fact that they do not report any test statistics but only state “p<.05” for any given effect. Sadly this means that their results cannot be used for a p-curve analysis.
Summary: results
Two papers find an interaction of stimulus and lateralisation with a greater difference between BM and nBM stimuli in the right hemisphere (HH05 and RHS06) – but the differences are in opposite directions. The other two papers find a significant difference between BM and nBM across hemispheres at mid-parietal electrodes P3 and P4 (RHLS08 and MS09) – but these two difference are again in opposite directions. Additionally, MS09 find an effect on lateral parietal electrodes P7 and P8, which again is in the opposite direction of their mid-parietal effect.
I don’t think I could have made up four less congruent results if I’d tried.
| ERP amplitude for upright motion | |||||
| contrast | electrodes/site | time window | M | SE | |
| HH05* | upright vs scrambled | right hemisphere: occipitotemporal area | 200-300 ms | -9 μV | 3 μV |
| RHS06 | upright vs inverted | right hemisphere: P4 and CP6 | 200-300 ms | +1.95 μV | 1.23 μV |
| RHLS08 | upright vs impossible | across hemispheres: P3 and P4 | 300-700 ms | +6.28 μV | 2.57 μV |
| MS09** | upright vs scrambled | P3 (right mid-parietal) P4 (left mid-parietal) P7 (right lateral parietal) P8 (left lateral parietal) | 800-2000 ms 1300-2000 ms 500-2000 ms 500-2000 ms | + + - - | ? ? ? ? |
| * Exact values were not provided in the text; the given values are estimates based on Figure 2B in the manuscript. ** MS09 do not provide amplitude means. Amplitude signs were taken from Figure 1 in the manuscript. |
|||||
Conclusion
Table 4 summarises the incongruity of ERPs across papers for upright BM alone. The most tragic aspect of this is that we cannot even sum up all effects and conclude that taken together, there is none: The analysed time windows and scalp regions were shifted around so much between studies that these contradictory findings might still be compatible with each other!
So – do infants show an observable ERP effect when they’re viewing PLDs of biological versus non-biological motion? I ran a p-curve analysis on the results of HH05, RHS06, and RHLS08 (MS09 couldn’t be included because they don’t report test statistics or exact p-values). I stuck to the instructions of Simonsohn, Nelson, and Simmons and made a p-curve disclosure table[6]The first time I did this so thoroughly and it was a great experience – I can very much recommend it. It forces you to track down the authors’ actual hypotheses and to think about which analysis would test them. It sounds trivial but it can be quite adventurous in the case of a not-so-tidy paper.. Three effects[7]I included the lateralisation x stimulus type interaction effect of HH05 and RHS06 and the upright vs impossible parietal contrast of RHLS08. are of course too small a sample for definitive conclusions, and the binomial tests for evidential value and lack of evidential value both come up not significant (p = .875 and p = .2557, respectively). But… Just look at it!
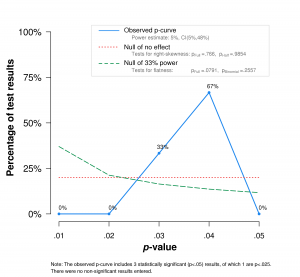
I have developed a new rule of thumb to decide if I believe the findings in a paper: If all p’s are ≧ .025, I’m not having any of it. Of course that can happen for true effects, but in three consecutive papers? Papers that weren’t preregistered? Papers that throw red flags of obscure if-I-fail-to-mention-it-it’s-not-a-lie phrasing in your face like confetti at a carnival parade? I don’t think so.
Now you may say: But this research is 8 to 12 years old! Times have changed and it seems like the motion perception folks have drawn the right conclusions from this carnage and stopped publishing papers on it. Right? Well. the reason I looked into this literature in the first place was that I reviewed a paper trying to build on it just this January.
I very much hope that infant ERP standards have improved since 2009, but the fact that a paper called “How to get statistically significant effects in any ERP experiment (and why you shouldn’t)” was published in Psychophysiology in December 2016 indicates that it’s probably not all good yet.
This story is an example for how cumulative science cannot work. If you want to build on the non-replicated work of someone else, we first need to know if you can replicate the original effect. If you can’t, that’s fine! If you find a somewhat different effect: That’s fine too! There might be truth in your findings. But we need to know about it. Tell us what happened at time X at electrodes Y and Z when you first looked at those, because we know you did.
Preregister your hypotheses and make exploratory analyses great again! Ok, I realise that preregistration wasn’t a thing in 2008, but from what I’ve heard, deduction and truthful reporting were. Exploratory analyses dressed up as confirmatory despite running counter to previous studies or even your own predictions are ridiculously easy to see through. Your readers aren’t that cheap. We can learn a lot from the results of data exploration, but only if we know the full context.
And, for the sake of completeness[8]Sigh.: No, N = 7 is not ok. N = 15 isn’t either, especially when we’re talking about 15 wiggly little monsters who hate EEG caps like nothing else and will decide that it’s time to go home after 35 trials. I’m not even criticising the huge exclusion rates – I have worked in an infant EEG lab and I know it’s impossible to get around that. But if you honestly don’t even have the resources for 20[9]Writing this causes almost physical pain when you know what’s needed are 3-digit numbers. “good” participants, team up with other labs[10]MASSIVE kudos to Michael Frank for starting this movement of saving developmental psychology’s neck. or just leave it be. Especially if your research isn’t a matter of life and death.
[Some wise yet witty concluding words I haven’t found yet]
—THE END—
A few more random oddities in case you’re interested.
- At the end of their paper, HH05 briefly report having tested a younger age group: “In a preliminary study, five 6-month-old infants were also measured for their ERPs during perception of BM and SM. Contrary to the 8-month-old infants, we did not find a significant ERP difference between the responses to BM and SM. However, we cannot conclude that 6-month-old infants do not process BM in such a small subject pool” (p. 303). I like how N = 5 is too small a sample but N = 7 isn’t.
- The (upright) stimuli used in RHS06 and RHLS08 sound identical, but RHLS08 do not cite their earlier paper (although the reason might have been to stay anonymous toward reviewers)
- EEG recording in RHS06 and RHLS08 sounds identical too, but the former report recording 19 scalp electrodes and the latter 23, which seems strangely arbitrary. Also I would like to point out again that RHS06 do not report any filters.
| RHS06 | RHLS08 |
| “EEG was recorded continuously with Ag–AgCl electrodes from 19 scalp locations of the 10–20 system, referenced to the vertex (Cz). Data was amplified via a Twente Medical Systems 32-channel REFA amplifier. Horizontal and vertical electrooculargram were recorded bipolarly. Sampling rate was set at 250 Hz. EEG data was re-referenced offline to the linked mastoids” (p. 212) | “EEG was recorded continuously with Ag-AgCl electrodes from 23 scalp locations of the 10–20 system, referenced to the vertex (Cz). Data were amplified via a Twente Medical Systems 32-channel REFA amplifier. Horizontal and vertical electrooculargram were recorded bipolarly. Sampling rate was set at 250 Hz. EEG data were baseline corrected and re-referenced offline to the linked mastoids. Data were filtered with high and low-pass filters from 0.1 to 35 Hz” (p. 164) |
- RHS06 use a strange formulation to describe the time frame they analysed: “For statistical analysis a time window was chosen around the amplitude peak of the effect from 200 to 300 ms after stimulus onset” (p. 212). Does that mean they averaged the amplitude between 200 and 300 ms like HH05 did? Or did they look for a peak somewhere between 200 and 300 ms and then analysed a time bin of unknown onset and length around this peak?
- RHLS08 use the same mysterious description: “For statistical analysis a time window was chosen in parietal regions (P3, P4) around the amplitude peak of the effect from 300–700 ms after stimulus onset” (p. 164). Interestingly, they use quite different language to describe the analysed time window in frontal regions: “For assessment of differences in frontal electrodes, we considered the mean amplitude in the three conditions from 200–350 ms after stimulus onset” (p. 164). Huh, so it’s not that they’re simply not able to use less convoluted language to tell us about how they computed an average. I can’t help but read these descriptions as “we looked at time window X but we won’t tell you which exact time bins within X we analysed”.
Footnotes
| ↑1 | For a good laugh I recommend having a look at Table 1 for sample sizes and exclusion rates though. |
|---|---|
| ↑2 | It’s totally a thing. |
| ↑3 | Because let’s face it, babies are a bit dim. |
| ↑4 | Phew! |
| ↑5 | I have a quantum theory of unreported test results: They are simultaneously significant and not significant until you look at them, which immediately renders them not significant. |
| ↑6 | The first time I did this so thoroughly and it was a great experience – I can very much recommend it. It forces you to track down the authors’ actual hypotheses and to think about which analysis would test them. It sounds trivial but it can be quite adventurous in the case of a not-so-tidy paper. |
| ↑7 | I included the lateralisation x stimulus type interaction effect of HH05 and RHS06 and the upright vs impossible parietal contrast of RHLS08. |
| ↑8 | Sigh. |
| ↑9 | Writing this causes almost physical pain when you know what’s needed are 3-digit numbers. |
| ↑10 | MASSIVE kudos to Michael Frank for starting this movement of saving developmental psychology’s neck. |
Great work! This is very thorough and a great summary.
These problems (small N, arbitrary selection of electrodes/times, bad statistical knowledge in general) are very common to the EEG/ERP field. Be sure that this does not only occur in developmental psychology but in many other fields utilizing ERP analyses as well.
I like this post very much, it is very elaborate and probably took much effort and time. Kudos to you!
Best, Benedikt
PS: I only have a very small thing to add, I wish it was more. And in addition it is completly unrelated to your conclusions: The reference in HH05 is average, whereas in the other ones linked mastoid. The electrodes you would expect an effect at, change with different references.
Thank you very much! That is a really important comment; I knew that all preprocessing/analysis choices affect the resulting ERPs in some way but I often don’t know in what way and to what extent.
Is it possible to backtrack these referencing effects? I mean: Can we make an educated guess about where the effects of HH05 would have popped up if they had used linked mastoids?
While referencing is a simple operation you can do at various times during your analysis, without access to the time-resolved linked-mastoid electrodes you cannot re-reference. That means you need access to the data they analyzed.
Maybe somebody with a lot of experience could make an educated guess. There are certain phenomenon that look this way if you use mastoids, and another very typical way for Cz, average etc. those could possibly be related.
The problem with average is that it depends on where the electrodes are placed on the cap. Thus comparing electrode-location of differences over studies is difficult (but it does have many benefits as well).